Using histograms to further understand
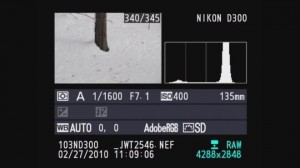
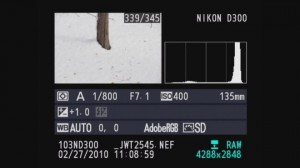
A histogram is just a map of the tonal values in our image from black (left most point) to white (right most point) with the height representing how much of the image is at a particular level of brightness. Your histogram will look the same in camera and when you open that image up in your imaging program.
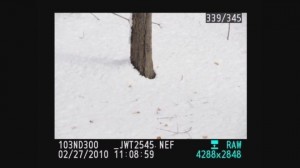
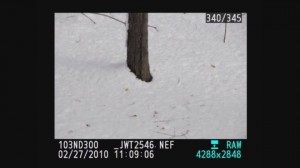
In the grey snow example above our histogram has a good deal of room before the white point on the right so the image represented by this histogram is a shade of grey not white. By overexposing one stop ( +/- +1.0) the camera automatically adjusts and allows 1 extra stop or twice the amount of light. As you can see from the histogram below we still have a small amount of room before the white point (this room indicates we have not blown out our highlights. If this histogram started all the way to the right and did not build to a peak, this would indicate over exposure and blown out highlights. The fix would be to reduce the exposure compensation from +1.0 to +0.7 and check again. The peak will move to the left each time you reduce your exposure. More on histograms in an upcoming tutorial.
Please let us know what you think of this tutorial and let us know what else is causing a challenge in your photography.


Pingback: Winter Shooting Tips 2011 at Bergen County Camera Blog
Pingback: Photography Tips and Walkthroughs at Bergen County Camera Blog
Pingback: Winter Photography at Bergen County Camera Blog